Project Dashboard
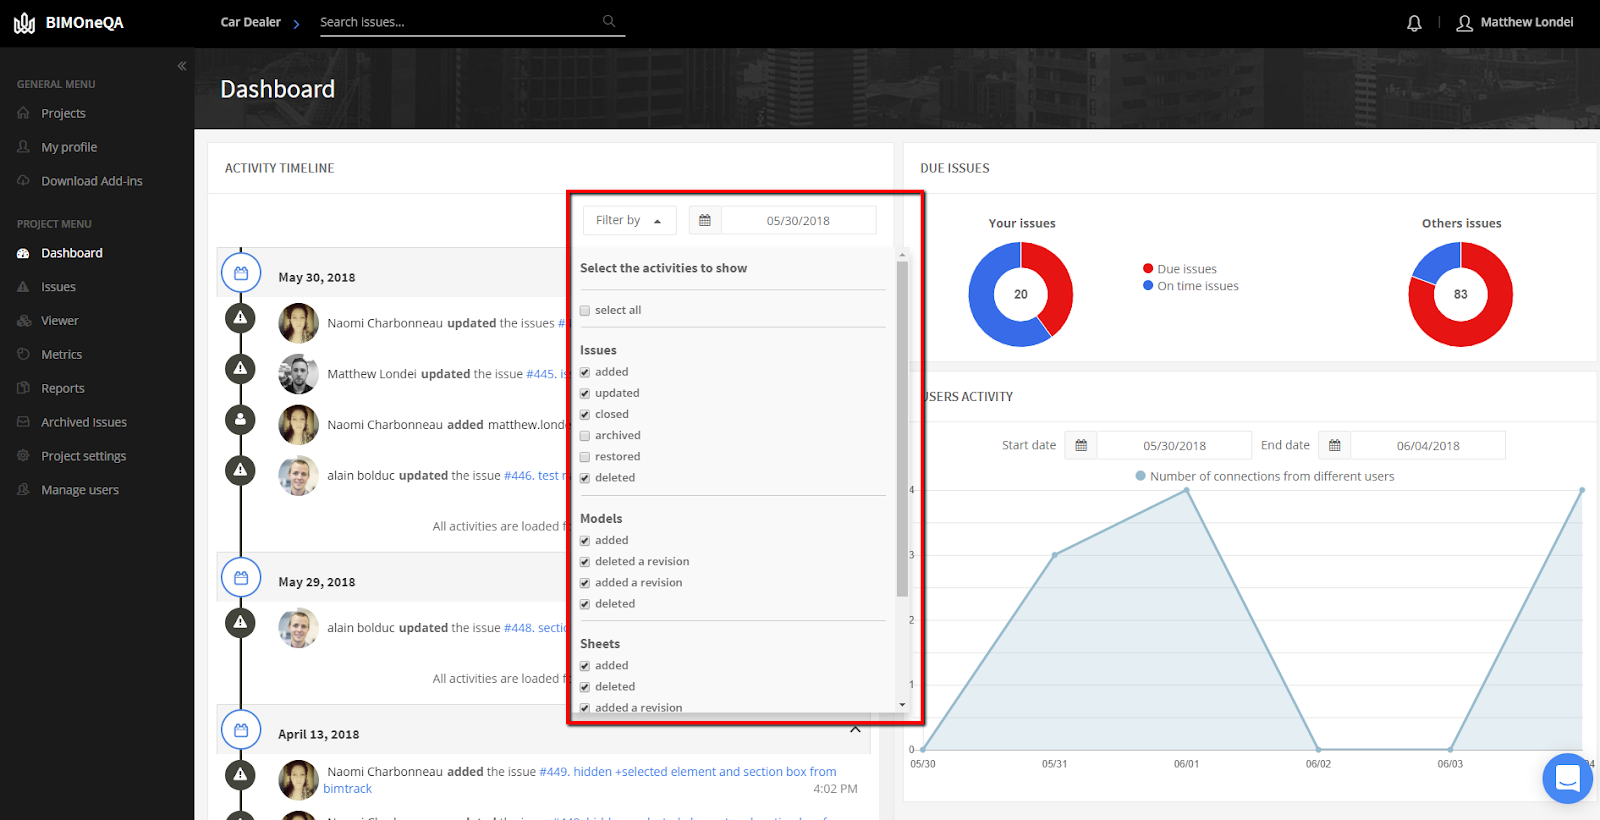
In the Dashboard portion of the Project Menu we can quickly see a detailed overview of the project’s latest activity, number of issues that are due vs. on time, and the number of users in the project and when they joined.
Activity Timeline
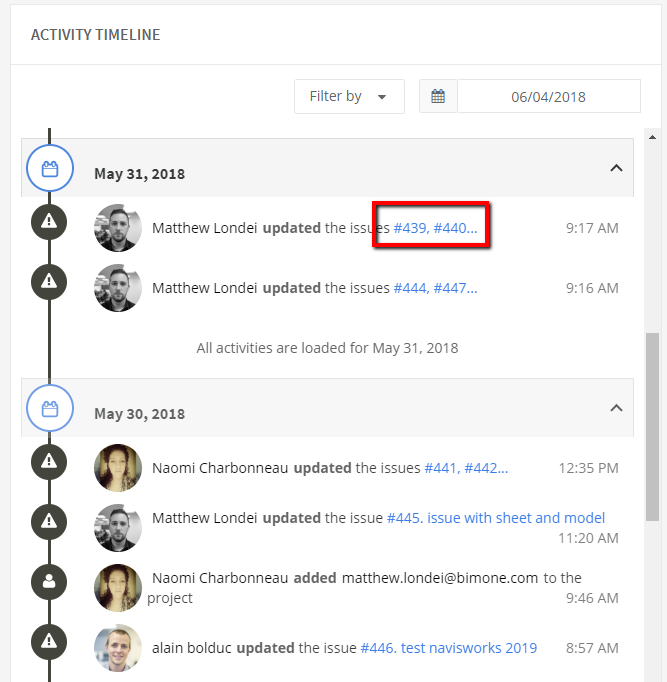
In the Activity Timeline all added issues, modifications to an issue, added/removed users, added/updated models, and any other changes are chronologically added. Date and time stamps are included on every line item.
When certain changes are applied, a hyperlink is provided. You can quickly select the link to be taken directly to the location in question. For example, if six issues are updated using the multi-edit command they will appear together as a single line item. Once the associated hyperlink is selected, you will be redirected to the issues page and shown those six issues.
The Filter by drop down allows for the selection of activities you want to show or hide on your timeline. For example, you can turn off the notification regarding issues being archived. This allows you to customize and see only what is pertinent to you in that project.
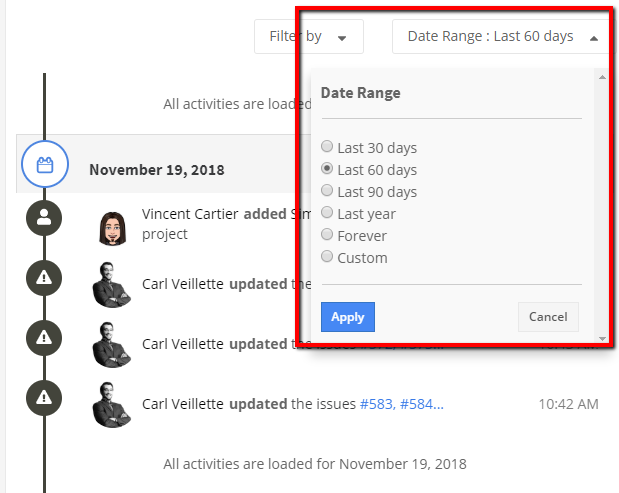
The date Range drop down allows you to select the last 30, 60, or 90 days, from the last year, from the start of the project, or from a custom start and end date to see all activities that took place on those days.
Due Issues
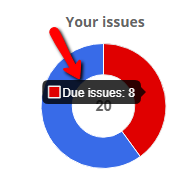
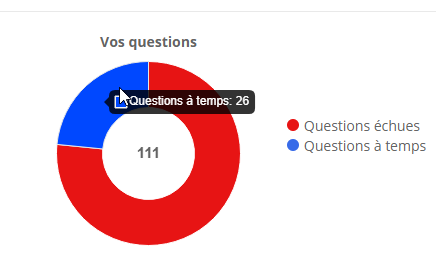
In the Due Issues portion of the page you will see two pie charts. The pie chart on the left are issues assigned to you. They are color coded and represent your on time issues vs. your due issues. The chart on the right is a global overview of all the issues in the project. They are color coded to represent past due issues vs. on time issues as well.
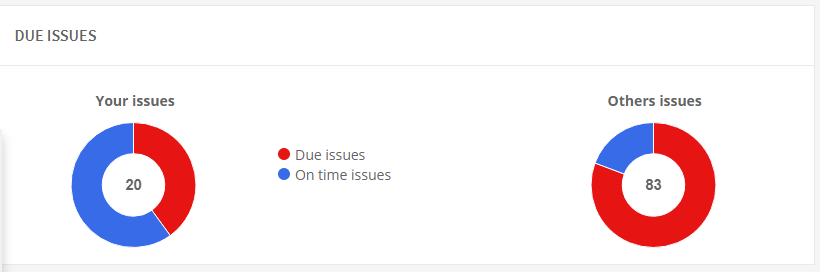
The pie charts are dynamic and if you hover your cursor of any part of either chart you will see the related number of issues. By clicking any portion of either pie chart you will be redirected to the issues page with the appropriate filters applied to see just those exact issues.
Keep in mind that if you’re looking at the overall project issues you may not be able to see all of them because of team access rights.
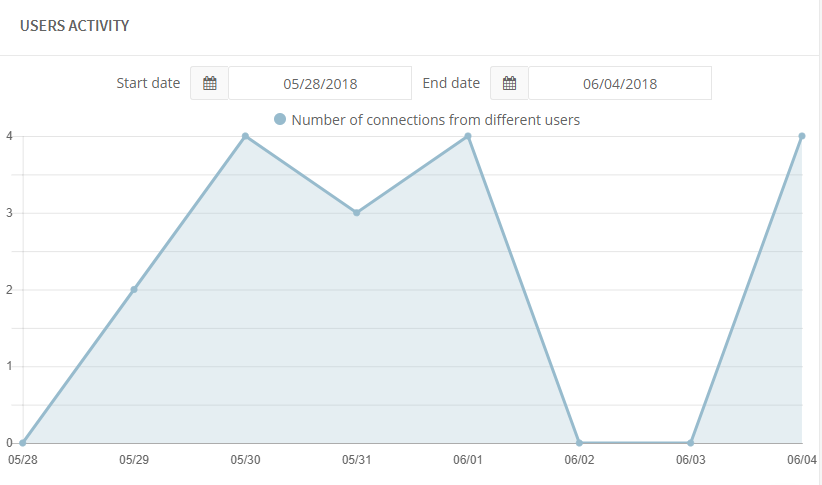
User Activity
The User Activity portion of the Dashboard records the daily number of users who have logged into the project. The number of connections includes users who have logged in with one of the authoring softwares as well. The Start date and End date selection will allow you to narrow down the dates that may need to be reviewed.