
Metrics Overview
Before you dive into your metrics, make sure you’ve set up mandatory issue attributes so that you can extract the information you want (see A deep dive into Issue Attributes).
The Metrics page allows a team to explore their project’s data so they can determine if it is on track. To access this page, open the desired project, then in the main menu, select Metrics.
We also have a data analytics solution that allows you to consume your data inside Power BI. For more information, please contact us by filling out this form.
Issue resolution metrics
When opening the Metrics page, the first things you will see are the issue resolution metrics.
- Average time to close an issue – For closed issues, this is the average time from creation date to close date.
- Average opened issues age – For all other issues except closed issues, this is the average time from creation date to present.
- Total number of issues – Total number of issues, including closed, archived and deleted issues.
Issue attributes chart
The Issue attributes chart is where you can search your project’s issues by different attributes ex: by status, priority, assigned to, etc. and drill down to get an accurate picture of your project’s coordination performance.
By default, issues are filtered by Assigned to and displayed in a pie chart, but you can and switch to the donut chart if you like. You also have the option of including archived issues.
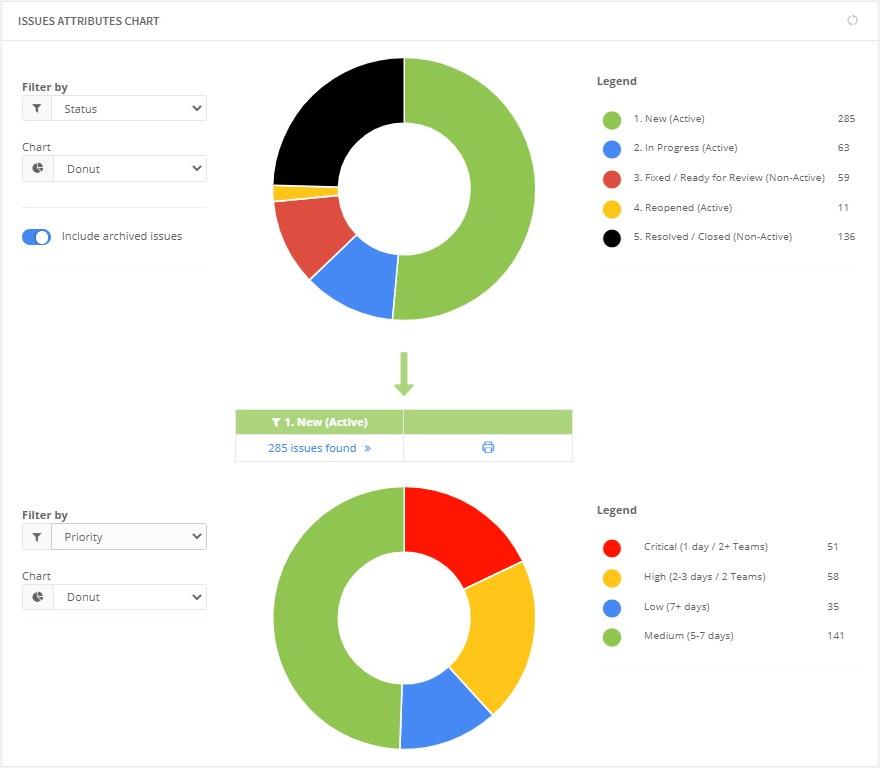
If you click on a portion, you can drill down into any of the attributes available and then open issues found (Ctrl + left click to open a new tab). In the issues page, the filter will be applied. You can then open individual issues, comment, etc. or you can create a quick filter that can be applied to see these issues from the Web platform or the add-ins.
It is also possible to generate a report directly from the issues page by clicking Print report at the top right of the list.
Please note that you cannot print the Metrics page the same way you generate a report. You can ‘print’ the page as you would every other web page or take a screenshot and attach it to your report/email.
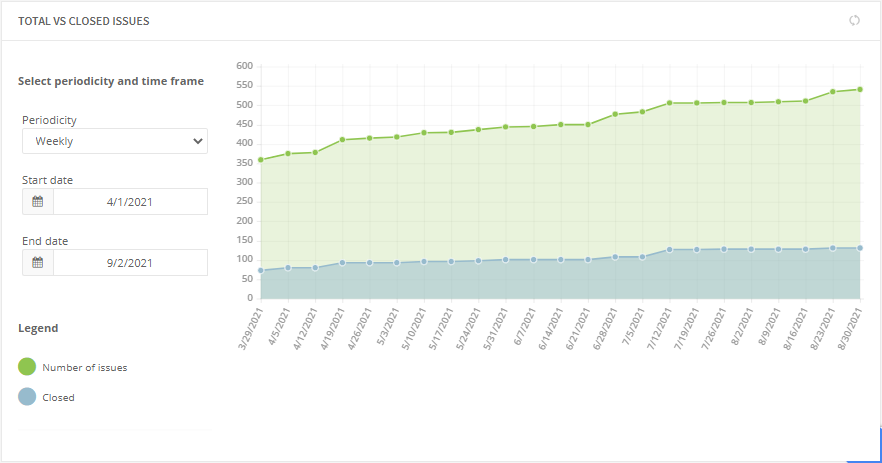
Total vs closed issues
This section allows you to take a high-level look to see if issues are being resolved quickly enough. Simply select the periodicity and time frame in which you want to compare total vs closed issues.
Please note that archived issues are also taken into account.
See also
-
- Check out our article Using Newforma Konekt Metrics as a Project Manager.
- Watch our webinar Mastering Metrics & Reports.