
Reports Overview
The Reports page allows you to generate customized BIM coordination reports for any type of stakeholder, regulatory body, or for governance purposes, and export or print your issues as needed.
To access this page and start creating a report, open the desired project, then in the main menu, select Reports.
Filters
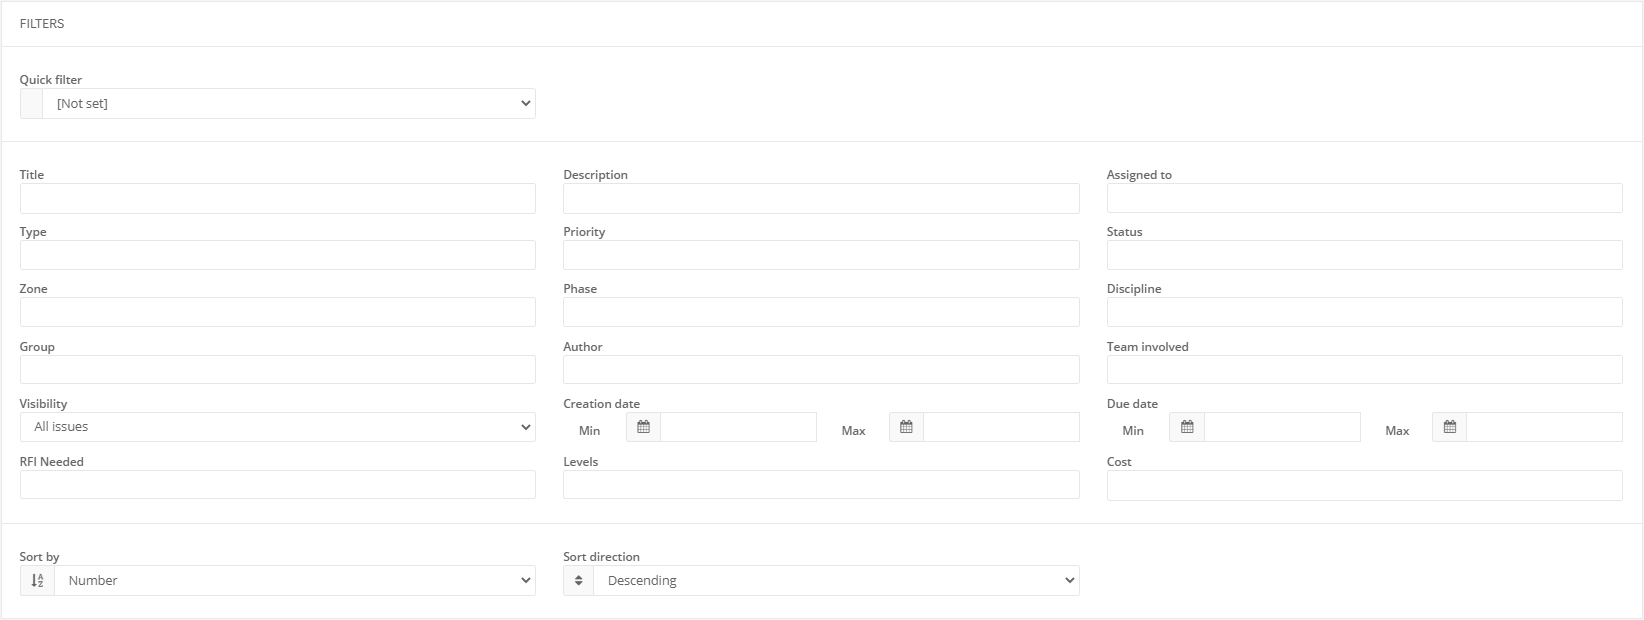
At the top of the page, just like in the Issue dashboard, you can filter the issues that will appear on the report so that the report only contains information related to your need.
It is recommended to keep the Title field clear.
Issue grouping
At the bottom of the filters section, you can customize the order the issues will appear in the report. Issues can be sorted based on various attributes such as their creation dates, due dates, last changed dates, priority, status, etc.
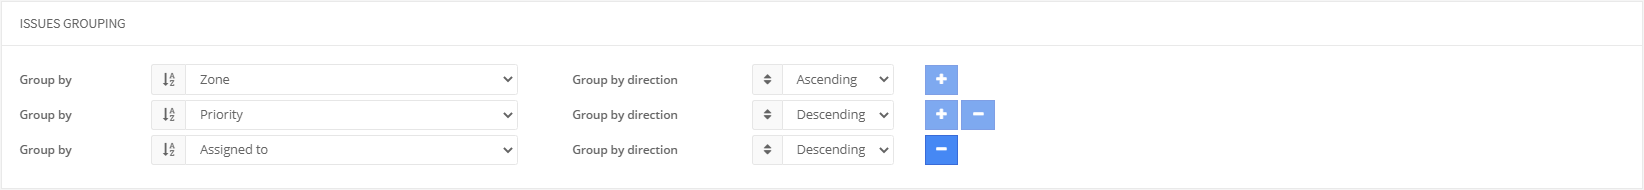
In the issue grouping section, you can add sorting levels to the report. To add an additional sorting level to the report, simply press the + button. A maximum of 3 additional sorting conditions can be added. Let’s say you want the issues to be sorted based on their priority (Critical, high, medium, low) and then by their zone. This can be done by setting the ‘Sort by’ field to ‘Priority’ and the ‘Group by’ field to ‘Zone’.
Issue properties
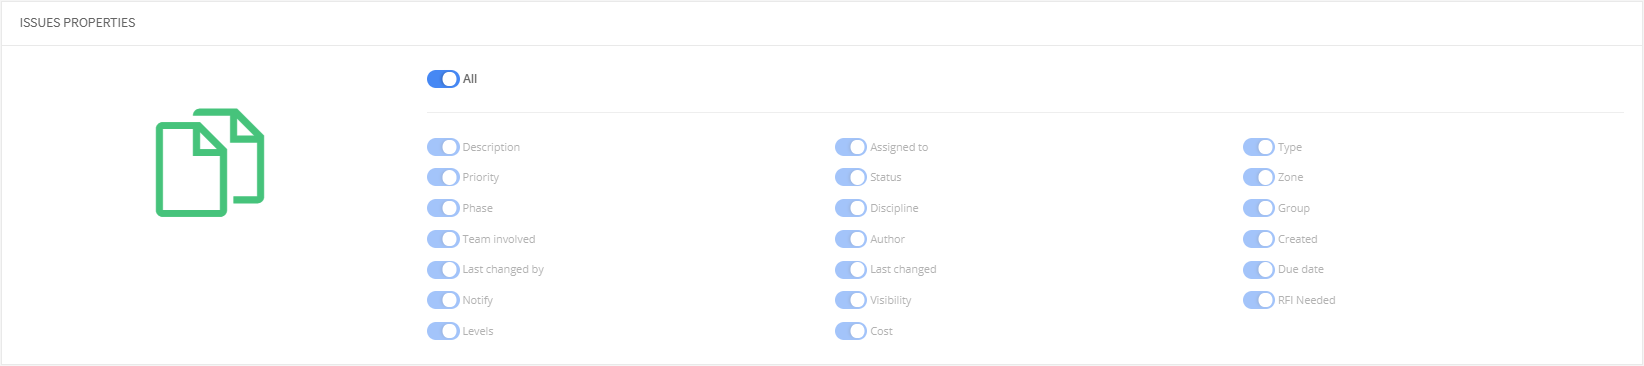
In the properties section you can configure which attributes will be included with each issue which gives you the ability to remove irrelevant information from the report.
Metrics
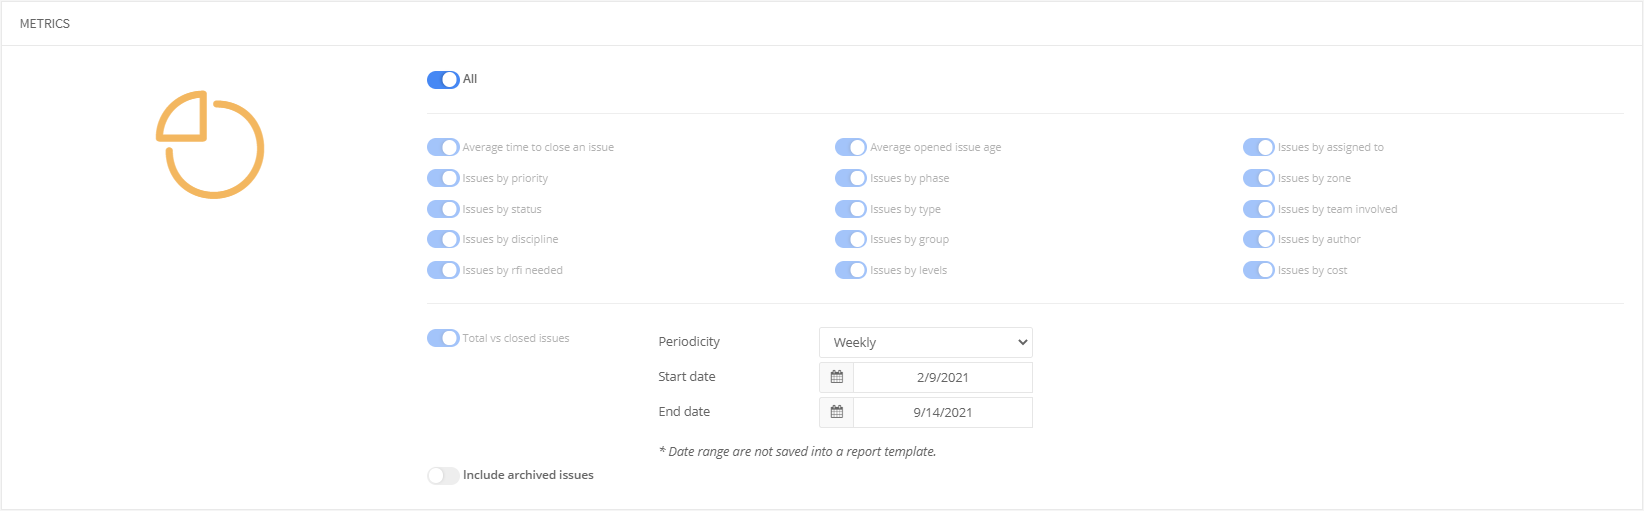
By default, various metrics are included in the report. The metric section gives you the ability to remove metrics from the report. The ‘Total vs Closed Issues’ is timeline type of metrics that will show the progress of the project based on a specific periodicity (Daily, weekly, monthly & yearly). This metric displays the total number of issues vs the number of closed issues. Giving you a quick insight on the progress of the project.
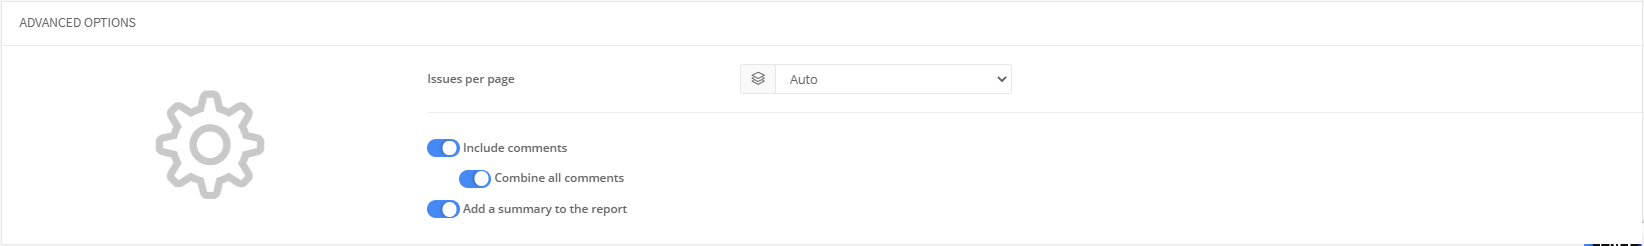
Advanced options
In the advanced options you can exclude the comments that were posted on the issue, change the order of the comment feed, change the number of issues that will appear on each page and add a summary to the first page of the report. The summary will display the filters that were applied to generate the report on the first page of the report, in the ‘Summary’ section.
Once you’ve defined your settings, you can print a report or create a template that you can use to schedule reports.
If your report is showing zero issues but you have a lot of issues in your project, it is possible that there are no issues corresponding to the criteria of your filters.
See also
- Watch our webinar Mastering Metrics & Reports.
- Read our blog post 50 tips for better BIM coordination meetings.